Autorin: Sarka Brodinova
This blog post looks at R from a data science point of view. In order to fully understand the role of R for Data Science, let’s first start with an explanation of what Data Science is and what R is.
What is Data Science?
Data Science has become a very popular term and it is widely used across different areas (e.g. finance, biology, industry). This implies the fact that if you ask 10 people about the definition of Data Science, you will probably get 10 different answers. Nevertheless, you could find some similarities among these answers, which could be summarized as follows:
- designing and maintaining complex database systems (i.e. datawarehouses) in order to consolidate all data of a company interest (i.e. combining air pollution data with geospatial data);
- performing various data analysis (from statistical to artificial intelligence techniques) on the consol- idated data to support company decisions (i.e. analyzing the combined data in order to identify air pollution areas and measure the effect of long-time solutions – planting additional trees or decrease the velocity on car roads);
- designing interactive dashboards or interfaces to present the outcome of performed methods in user-friendly and understandable form (i.e. designing a web-based application for a city government to support planning of infrastructure and to handle environmental issues).
At solvistas, we make no difference among these points. We look at Data Science from all three perspec- tives in order to give our clients as much as possible information they need in such a form that fits them most.
The concept of Data Science at solvistas is visualized in Fig.1. The data of a client interest are first identified and then loaded into the datawarehouse on a regular basis. Datawarehouse is efficiently main- tained in order to finally perform data analysis, data visualization or reporting. The entire process is fully automatized hand in hand with client needs in order to provide the required information on time.
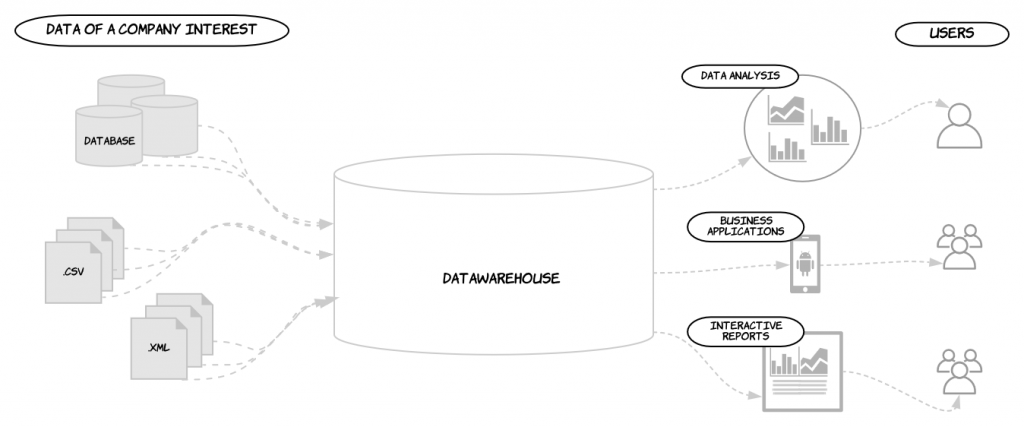
Figure 1: The concept of Data Science at solvistas
To cover all three perspective, different tools are required to be integrated in a company system. One of these tools is, for example, the R software.
What is R?
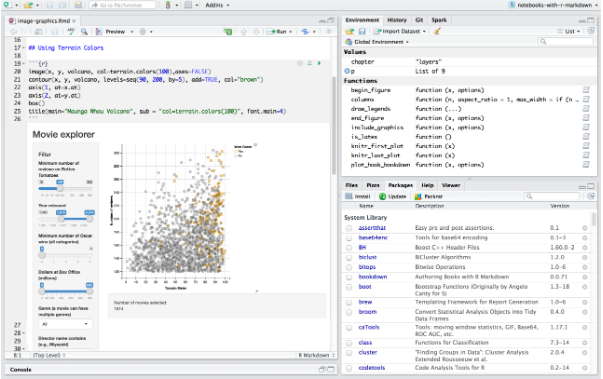
R is both a programming language and an open free environmental system designed for statistical com- putation and graphics [1]. The R software and its packages in the combination with RStudio (IDE) [2] allow performing different tasks.
The following list gives several examples of such tasks [3].:
- applying data analysis using either build-in functions from packages or own designed functions
- manipulating & visualizing data with geospatial information
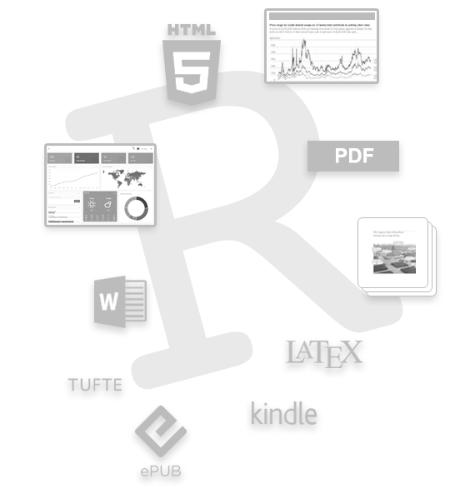
- implementing interactive and dynamic dashboards, reports, books and shiny applications in HTML output format
- combining the results of performed methods with data visualization and comments in variety forms, such presentations or reports (PDF, MS Word output format)
- extracting web data (i.e. web scraping)
- connecting to various databases (e.g. Oracle, Postgresql, Netezza)
- using other programming languages (e.g. SQL, Python, C++) and version control (e.g. GitHub)
The big favor of integrating R is using Shiny package which allows to easily design web-based dashboards in order to interact with your data from various perspective in the graphical fashion [2]. The area of applying R as well as the R community is rapidly growing. The number of R users was estimated at over 2 million [7]. R is mainly used for academic and statistical purposes. Nevertheless, R has recently gotten attention in the healthcare industry [8]. The broad integration of R is very helpful for quickly sharing ideas across different fields and developing innovative concepts.
Cons of R
Now you could see R as a pretty much powerful tool. Nevertheless, R has also several bottlenecks. As R is an open source software, there is no official support. This does not mean that nobody will help when needed. Indeed, you might get a support from the R community even faster in comparison to a support from a commercial software. As R has been using since the 1990s, its community became strong. This leads to a stable network of free resources where you can learn about R or ask for a support (e.g. Stack Overflow [4], R bloggers [5], DataCamp [6]).
Although R enables performing a huge amount of various data analysis techniques, your data must be loaded in memory every time you analyze them. Therefore, working with big data might be impossible unless you have a powerful server, or you go for cloud computing (e.g. Amazon Cloud).
Another difficulty you might face to is computation time. However, the computation costs can be optimized by integrating R in a company system more efficiently.
The Role of R for Data Science?
After giving a brief overview of what R can do, let’s summarize the role of R for Data Science. R is not definitely for designing and maintaining datawarehouses. Nevertheless, R is a modern component of the datawarehouse for achieving professional data analysis. Since R can directly extract the data from databases, you can easily explore or analyze the data in a way you like. Static reports, presentations, or interactive dashboards can additionally contain geospatial information to bring into your analysis an additional point of view. Therefore, R can be very helpful to support your crucial decision based on data- driven answers. Go with trends so do some well-known companies, where R has been successfully integrated, such as: NASA, Hyundai, Allianz, Samsung, Avon and many more (see [1]).
References
[1]The R Project for Statistical Computing, https://www.r-project.org.
[2]RStudio, https://www.rstudio.com.
[3]CRAN Task Views, https://cran.r-project.org/web/views.
[4]Stack Overflow, https://stackoverflow.com.
[5]R bloggers, https://www.r-bloggers.com.
[6]DataCamp, https://www.datacamp.com/home.
[7]https://blog.revolutionanalytics.com/2014/04/a-world-map-of-r-user-activity.html